- Written by: Hummaid Naseer
- October 2, 2025
- Categories: Services & Products
Order fulfillment is where customer expectations meet operational reality. You may have the best products and the most engaging marketing campaigns, but if orders are delayed, incorrect, or too costly to deliver, customers won’t come back, and word spreads quickly.
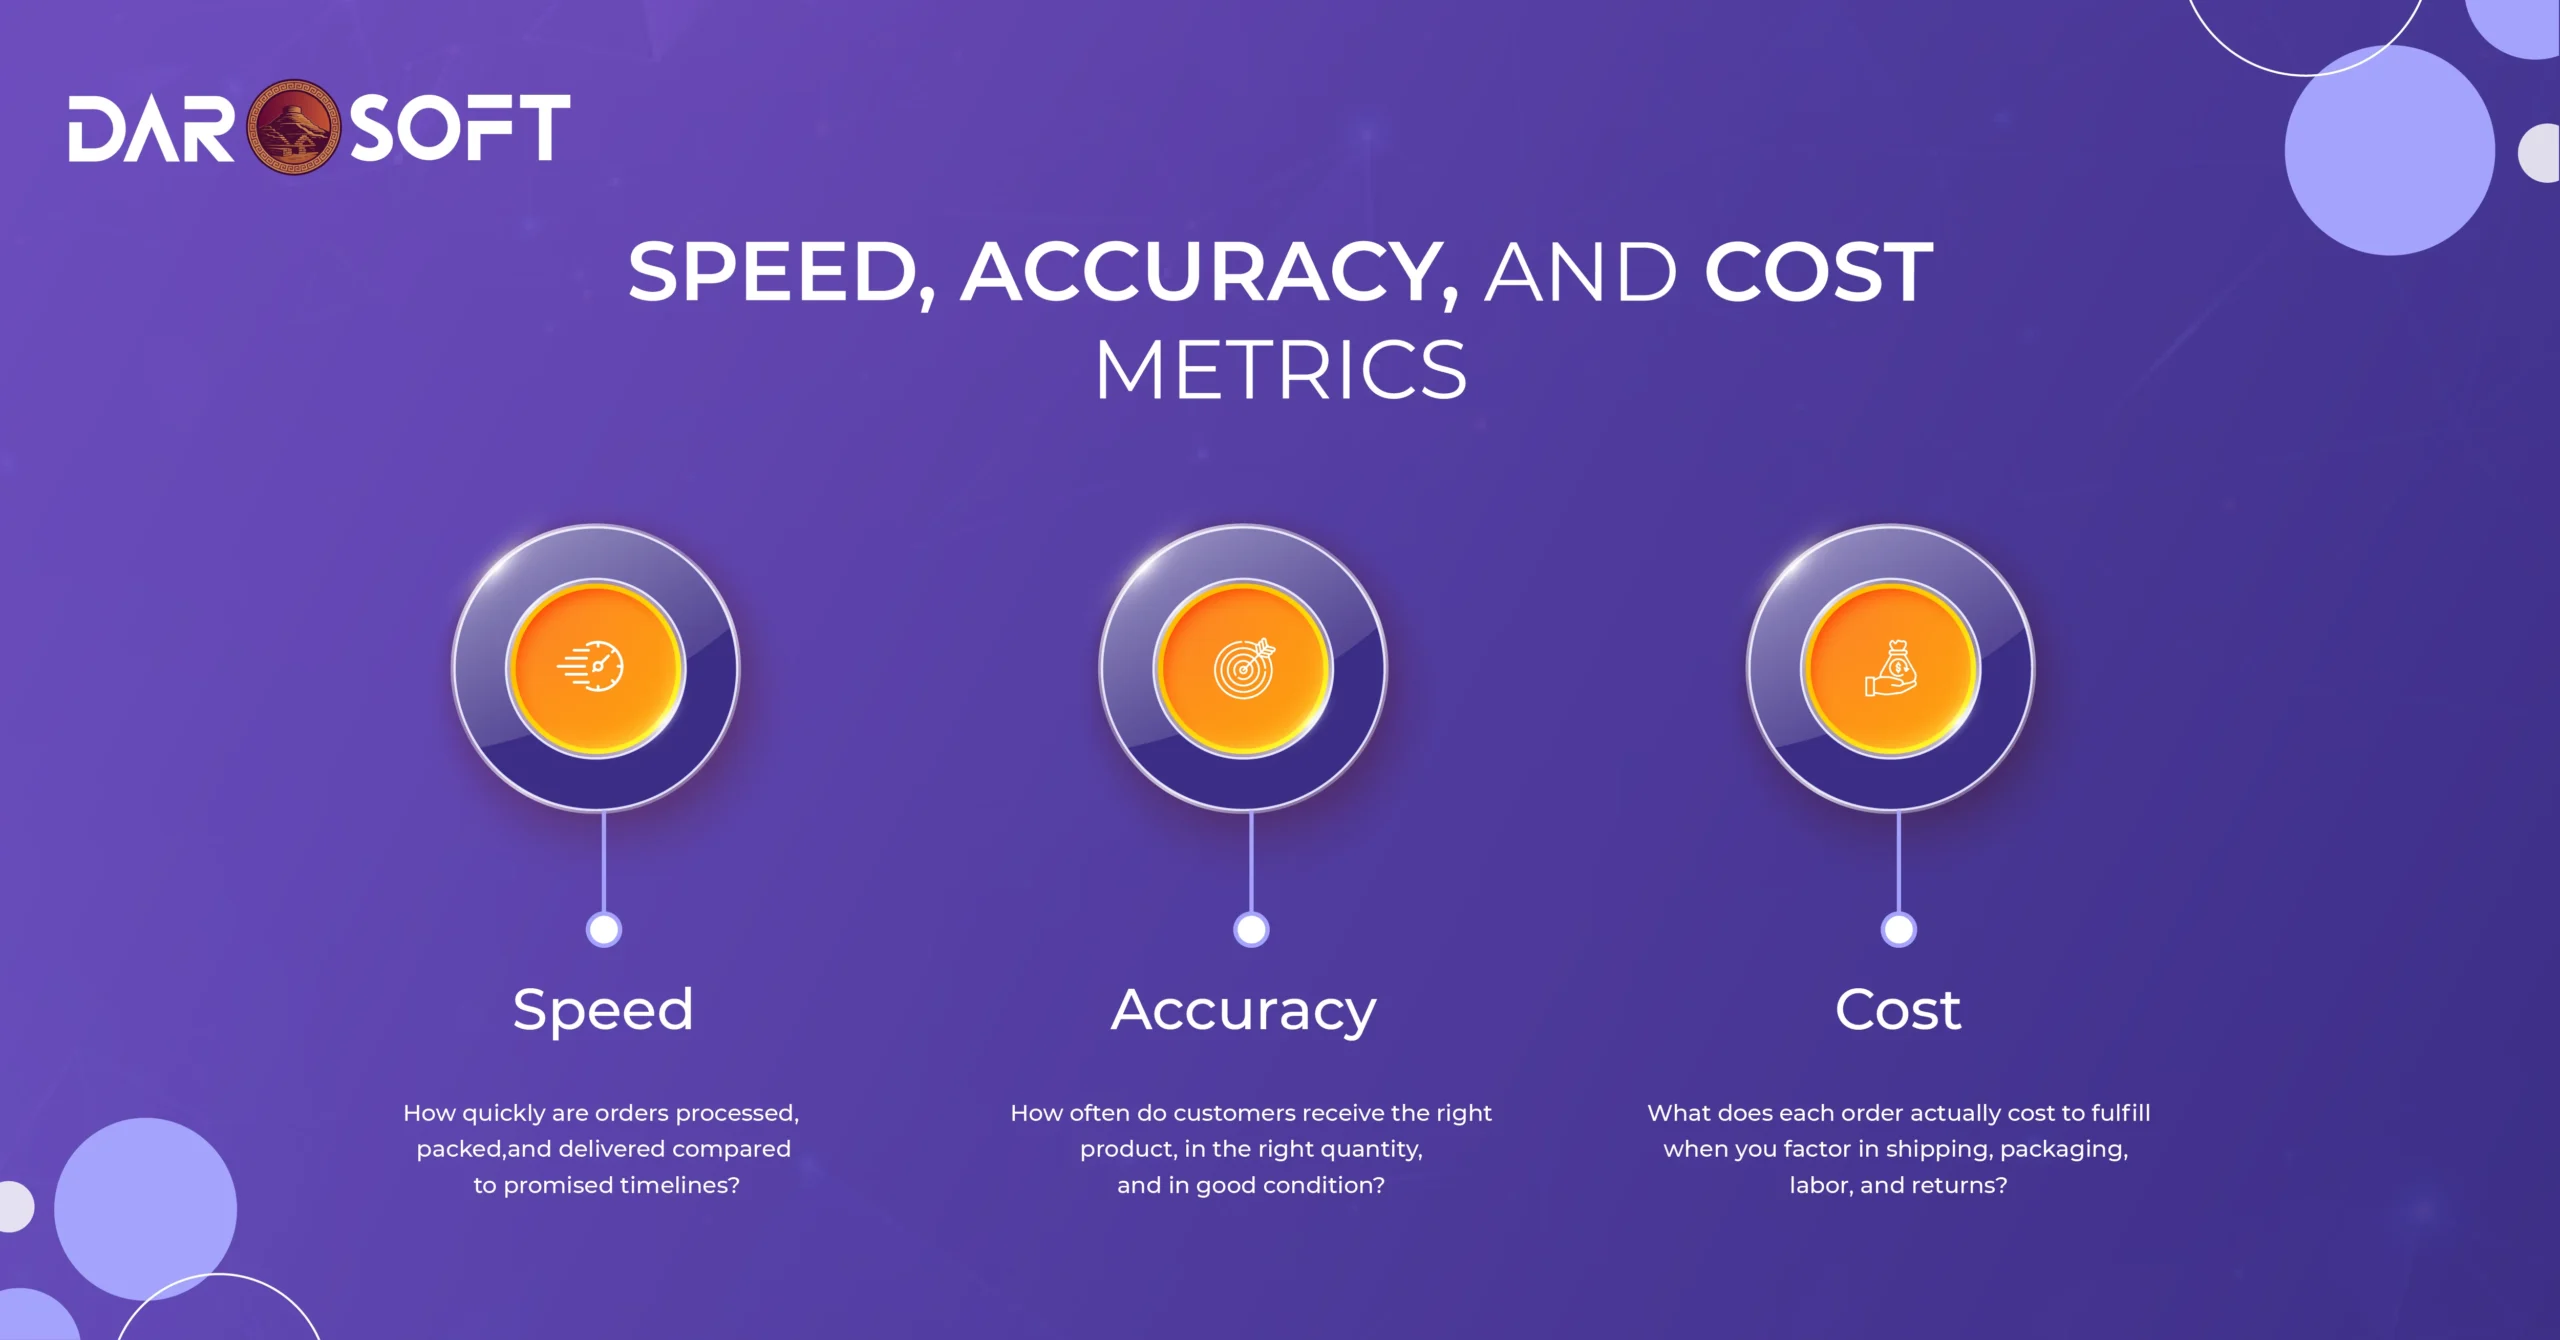
That’s why order fulfillment reporting is critical. It doesn’t just track how many orders are shipped; it measures the speed, accuracy, and cost-effectiveness of your fulfillment process. These reports answer key questions like:
Speed → How quickly are orders processed, packed, and delivered compared to promised timelines?
Accuracy → How often do customers receive the right product, in the right quantity, and in good condition?
Cost → What does each order actually cost to fulfill when you factor in shipping, packaging, labor, and returns?
Why it matters for businesses
Customer Satisfaction & Retention: Fast, accurate deliveries lead to repeat customers and positive reviews.
Operational Efficiency: Reports highlight bottlenecks in warehousing, picking, or shipping so you can fix them before they scale.
Profitability: Tracking fulfillment costs helps you understand whether logistics are eating into margins.
Scalability: As your business grows, fulfillment reporting ensures processes stay efficient instead of breaking under higher volume.
Order Processing Time: How Fast Orders Move from Checkout to Dispatch
Order processing time measures the duration between when a customer completes their purchase (checkout) and when the order is officially dispatched for shipping. This includes all back-end activities such as:
Payment verification
Order confirmation
Picking items from storage
Packing and labeling
Handing over to the carrier or delivery fleet
It’s essentially the “engine room” of fulfillment; the faster and more accurate it runs, the smoother the customer experience.
Why It Matters
Customer Expectations in the Era of Speed
Modern shoppers expect quick turnarounds, often comparing every store’s speed to benchmarks set by Amazon, Daraz, or Walmart.
A long processing lag can frustrate customers, even if shipping afterward is fast. For example, a 3-day “processing” delay makes 2-day delivery promises irrelevant.
Revealing Bottlenecks in Operations
If average processing times are consistently high, it signals inefficiencies such as:
Poor inventory placement (pickers walking too far to collect items).
Manual order confirmation instead of automated workflows.
Inadequate staffing during peak hours.
This insight lets managers pinpoint where workflows need restructuring or automation.
Competitive Advantage
Fast order processing doesn’t just meet expectations; it can differentiate your brand. Businesses that can reliably ship same-day or next-day earn repeat customers and positive reviews.
Conversely, slow processors risk higher cart abandonment rates if delivery times look unattractive.
Financial Impact
Inefficient processing translates to higher labor costs and wasted warehouse resources.
Faster, more optimized processing reduces “handling cost per order,” directly protecting margins.
Key Metrics to Track
Average Processing Time: e.g., 4 hours per order.
Peak vs. Off-Peak Processing Time: Compare how times change during sales events, weekends, or seasonal rushes.
% of Orders Processed Within Target Window: (e.g., 90% of orders processed in under 6 hours).
Exception Cases: Orders delayed due to out-of-stock items, payment issues, or manual reviews.
Pro Tip
Set internal Service-Level Agreements (SLAs). For example:
Standard Orders → Processed within 4–6 hours.
Priority/Express Orders → Processed within 1–2 hours.
Use automation tools like Logisticify by Darosoft to streamline order routing, reduce manual verification steps, and sync inventory in real time. With built-in dashboards, you can spot lagging orders instantly, automate alerts, and balance workload across staff, ensuring no customer gets left waiting unnecessarily.
Picking and Packing Accuracy: Reducing Errors Before Shipping
Picking and packing accuracy measures how often orders are correctly fulfilled with the right items, quantities, and packaging before being shipped out. It covers two critical stages:
Picking – Selecting the correct items from warehouse inventory.
Packing – Placing the right items in the right packaging, with proper labeling and documentation.
Any mistake here wrong size, missing item, incorrect color, or damaged goods, directly impacts customer satisfaction and return rates.
Why It Matters
Direct Impact on Customer Trust
A single wrong order can frustrate a customer, but repeated mistakes destroy trust in your brand.
Accuracy in fulfillment = reliability. Customers who trust your fulfillment process are more likely to reorder and recommend.
Cost of Errors
Every mispick or mispack leads to:
Return shipping costs.
Replacement product costs.
Additional labor for restocking and re-shipping.
These errors add up quickly, eating into already thin fulfillment margins.
Operational Efficiency
High accuracy means fewer returns, fewer customer complaints, and smoother workflows.
Low accuracy creates chaos warehouses spend more time fixing mistakes than fulfilling new orders.
Competitive Advantage
In markets where multiple players sell the same products, order accuracy can be the difference between keeping and losing customers.
“They always get it right” is as powerful as “they deliver fast.”
Key Metrics to Track
Picking Accuracy Rate = (Correct items picked ÷ Total items picked) × 100
Packing Accuracy Rate = (Correctly packed orders ÷ Total orders packed) × 100
Error Rate = Number of incorrect orders ÷ Total orders shipped
Cost per Error = (Total costs from returns/replacements ÷ Total errors)
Example benchmarks:
Industry-leading fulfillment centers aim for 99.8%+ picking accuracy.
Anything below 97–98% signals room for improvement.

On-Time Delivery Rate: Measuring Customer Satisfaction
On-Time Delivery (OTD) rate measures the percentage of orders delivered to customers within the promised time frame. It reflects how reliably your business (and logistics partners) meet delivery commitments.
Formula:
On-Time Delivery Rate (%) = (Orders delivered on time ÷ Total orders shipped) × 100
This KPI sits at the heart of customer satisfaction because it represents the final stage of the fulfillment process, when the product actually reaches the customer.
Why It Matters
Customer Expectations Are Non-Negotiable
Modern customers expect fast and reliable delivery “2 days means 2 days,” not 3 or 4.
Missing deadlines erodes confidence in your brand, regardless of product quality.
Direct Link to Satisfaction & Loyalty
A high OTD rate builds trust: customers know they can count on you.
A single late order may be forgiven, but a pattern of delays pushes customers to competitors.
Financial Impact
Late deliveries often mean additional costs: expedited replacements, refunds, or waived shipping fees.
Missed deadlines also increase returns, as customers cancel or reject late shipments.
Competitive Benchmark
Industry leaders like Amazon set high standards (95–98% OTD).
Falling behind means losing customers to competitors who consistently deliver on time.
Key Metrics to Track
Promised vs. Actual Delivery Dates – The gap between what was promised at checkout and what was achieved.
Late Delivery Rate = (Orders delivered late ÷ Total orders shipped).
Carrier Performance – % of delays attributed to third-party logistics providers.
Delivery Time by Region/Channel – Identifies where delays happen most (urban vs. rural, own fleet vs. courier).
Order Cycle Time: End-to-End Fulfillment Speed
Order Cycle Time (OCT) measures the total time it takes to fulfill a customer’s order from start to finish, from the moment an order is placed (checkout) until the product is delivered to the customer’s doorstep.
Formula:
Order Cycle Time = Delivery date – Order placement date
It is one of the most comprehensive KPIs in fulfillment because it covers the entire journey: order processing, picking, packing, dispatch, transit, and final delivery.
Why It Matters
True Measure of Customer Experience
OCT captures how long customers actually wait after purchase.
A short cycle time leads to faster gratification and higher satisfaction.
Reveals Bottlenecks Across the Supply Chain
Long OCTs may indicate slow order processing, poor warehouse efficiency, or unreliable couriers.
Pinpointing the exact delay helps prioritize operational improvements.
Competitive Benchmarking
Industry leaders have OCTs as low as 1–2 days (same-day or next-day fulfillment).
Businesses with OCTs exceeding 5–7 days risk losing customers to faster competitors.
Financial Impact
Longer cycle times increase customer service complaints, refunds, and cancellations.
Faster fulfillment often drives repeat purchases, increasing lifetime value (LTV).
Key Metrics to Track
Average Order Cycle Time = Total cycle time ÷ Number of orders.
Cycle Time by Channel: Compare online store vs. retail vs. wholesale.
Cycle Time by Region: Urban vs. rural delivery times.
Breakdown by Stage: Processing time, warehouse handling, and courier transit.
Fulfillment Cost per Order: Balancing Efficiency with Profitability
Fulfillment Cost per Order (FCO) measures the total expense incurred to process, package, and deliver a single order. It combines all the costs associated with order fulfillment, including:
Order processing (software, staff, admin time)
Warehouse operations (picking, packing, storage)
Packaging materials (boxes, labels, inserts)
Shipping and logistics (courier fees, last-mile delivery)
Returns management (reverse logistics, restocking)
Formula:
Fulfillment Cost per Order = Total fulfillment costs ÷ Number of orders fulfilled
Why It Matters
Direct Impact on Profitability
Even if sales are strong, high fulfillment costs can erode margins.
Tracking FCO ensures growth is profitable, not just scalable.
Benchmark for Pricing & Discounts
Helps set minimum order values, shipping fees, or free-delivery thresholds.
Protects businesses from running loss-making promotions.
Operational Efficiency Indicator
High FCO highlights inefficiencies like manual processes, overstaffing, or poor courier rates.
Reducing FCO without hurting quality builds a sustainable advantage.
Competitive Positioning
Customers expect low-cost or free shipping. Brands that control FCO can offer attractive shipping options without sacrificing profit.
Key Metrics to Track
Average FCO by Channel – Online store vs. marketplace vs. wholesale.
Packaging Cost per Order – How much packaging contributes to FCO.
Shipping Cost per Order – Largest cost driver; varies by courier/region.
Return Handling Cost – Percentage of orders returned and their processing expense.
Labor Cost per Order – Wages/time spent per fulfilled order.

Return Rate & Error-Related Costs: Tracking the Hidden Expenses
Return Rate measures the percentage of fulfilled orders that customers send back. Error-Related Costs track the financial impact of mistakes during fulfillment (wrong item, wrong quantity, damage, late delivery, etc.). Together, these metrics expose the hidden costs that quietly eat into profits.
Formulas:
Return Rate (%) = (Number of returned orders ÷ Total fulfilled orders) × 100
Error-Related Costs = Total cost of replacements, refunds, and reshipping caused by mistakes
Why It Matters
Returns Hurt More Than Just Sales
Returns don’t just reduce revenue; they also add reverse logistics, inspection, restocking, and customer service costs.
High return rates indicate product quality issues, misleading product descriptions, or delivery delays.
Error Costs Compound Quickly
Sending the wrong SKU, mispacking, or late deliveries result in replacement shipments and refunds.
Each error multiplies costs: extra labor, additional shipping, and reputational damage.
Customer Trust at Risk
A single error may be forgiven, but recurring mistakes reduce loyalty and increase churn.
High return rates lower lifetime value (LTV) because frustrated customers don’t return.
Profitability Drain
Even small return rates (5–10%) significantly reduce net margins in e-commerce.
Poor error management can turn “profitable” orders into losses.
Key Metrics to Track
Return Rate by Category: Some products (e.g., apparel, electronics) naturally have higher return rates.
Reason for Returns: Wrong size, damaged item, late delivery, defective product.
Error Source Breakdown: % errors from warehouse picking/packing vs. courier mishandling vs. system issues.
Cost per Error: Average financial hit of an incorrect order.
Customer Impact: % of customers who never purchase again after an error.
Carrier Performance Report: Evaluating Shipping Partners
A Carrier Performance Report tracks how well your logistics and shipping partners deliver on speed, reliability, and cost efficiency. It helps you evaluate whether your current carriers are meeting service level agreements (SLAs) and keeping customers satisfied.
What It Shows
On-Time Delivery Rate: % of orders delivered within the promised timeframe.
Transit Time Variance: Average vs. actual delivery times.
Cost per Shipment: Total shipping spend divided by the number of orders shipped.
Damage/Claim Rate: % of shipments reported damaged, lost, or requiring insurance claims.
Customer Feedback by Carrier: Ratings or complaints tied to a specific courier.
Coverage & Reach: How well carriers handle different regions or delivery types (same-day, COD, express).
Why It Matters
Direct Impact on Customer Experience
Late or damaged deliveries affect brand perception even if the carrier is at fault.
Reliable carriers = higher customer satisfaction = more repeat business.
Cost Control
Shipping costs often account for 10–20% of the order value in e-commerce.
Poor carrier performance leads to higher returns, reshipments, and customer service costs.
Operational Agility
Knowing which carriers excel in which regions helps optimize routing.
Avoids dependency on a single courier and ensures backup options during peak demand.
Negotiation Power
Performance reports give leverage in contract negotiations with carriers.
You can request better rates or SLA adjustments based on actual data.
Key Metrics to Track
On-Time Delivery %: Are orders arriving when promised?
Shipment Cost Trends: Are rates increasing disproportionately?
First-Attempt Delivery Success Rate: Especially important for COD markets.
Return-to-Origin (RTO) Rate: Frequency of undelivered packages returned.
Regional Performance: Carrier efficiency by city/zone.

Customer Experience Metrics: Feedback, Complaints, and NPS
Customer Experience (CX) Metrics track how buyers feel about your fulfillment process. Beyond speed and accuracy, the perception of service from order tracking to delivery directly impacts loyalty. Feedback, complaints, and Net Promoter Score (NPS) help businesses measure how fulfillment performance translates into customer trust.
What It Shows
Customer Feedback – Ratings, surveys, or post-purchase reviews about delivery speed, packaging, and overall satisfaction.
Complaints & Service Tickets – Number and types of issues reported (delayed deliveries, damaged goods, missing items).
Net Promoter Score (NPS) – A loyalty metric asking: “How likely are you to recommend us to a friend or colleague?”
Satisfaction by Touchpoint – Breaks down feedback across order confirmation, tracking, delivery, and returns.
Why It Matters
Direct Link to Retention
A smooth fulfillment experience encourages repeat purchases.
Negative experiences (delays, damages) quickly push customers to competitors.
Early Problem Detection
Spikes in complaints highlight bottlenecks in processing, packaging, or carrier performance.
Helps fix operational issues before they escalate.
Brand Differentiation
In competitive markets, CX often matters more than price.
Higher NPS indicates stronger word-of-mouth and organic customer acquisition.
Financial Impact
Each unresolved complaint can cost more than the profit on that order.
Companies with higher NPS scores often grow revenue 2–3x faster than their competitors.
Key Metrics to Track
NPS (Net Promoter Score): % of promoters (scores 9–10) minus % of detractors (scores 0–6).
Complaint Rate: % of orders resulting in a service ticket or complaint.
Customer Effort Score (CES): How easy was it to resolve an issue or track an order?
Satisfaction by Channel: Compare experience for online, offline, and regional orders.
Repeat Purchase Rate: Indirectly reflects fulfillment satisfaction.
Building a Smarter Fulfillment Strategy
Order fulfillment is no longer just about moving boxes from point A to point B; it’s about delivering speed, accuracy, cost-efficiency, and customer trust all at once. Every stage of the process leaves a trail of data, and when businesses harness that data through reporting, they move from reactive firefighting to proactive strategy.
The ultimate goal isn’t just efficiency, it’s profitable growth. Fast and accurate fulfillment drives customer satisfaction. Smarter cost control protects margins. Better carrier and partner evaluations prevent disruptions. And customer experience metrics like NPS tie fulfillment directly to long-term loyalty.
This is where tools like Logisticify by Darosoft become game changers. With automated reporting, AI-driven insights, and integration across sales, inventory, and fulfillment channels, Logisticify helps businesses transform raw data into actionable intelligence. Instead of guessing where problems lie, you can see them in real time and fix them before they impact revenue or customer trust.